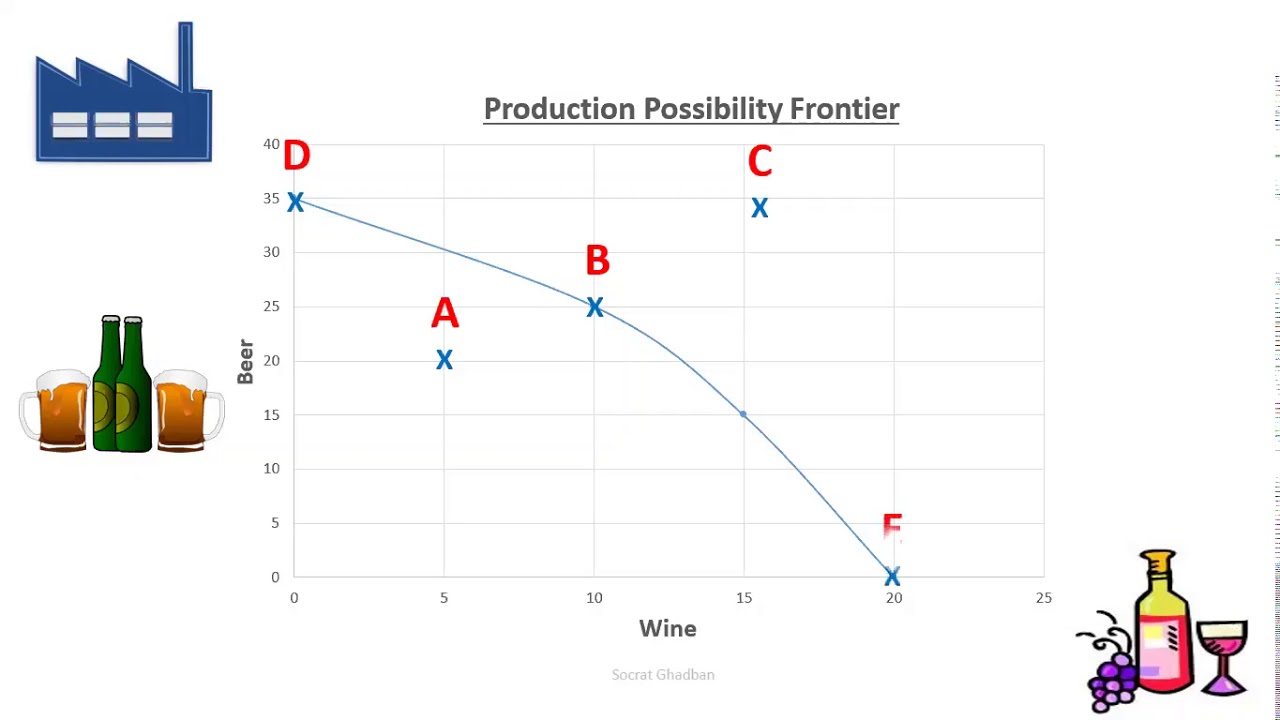
Production possibility frontier PPF also called production possibility curve PPC is A graph that shows all the combinations of goods and services that can be produced if all of society’s resources are used efficiently.
All points below and to the left of the curve (production possibility frontier) represent combinations of Beer and Wine that are possible for the society given the resources available and existing technology.
Although an economy may be operating with full employment of its land, labor, and capital resources, it may still be operating inside its ppf (production possibility frontier), at a point such as A. The economy could be using those resources inefficiently.
Periods of unemployment also correspond to points inside the ppf (production possibility frontier), such as point A.
Moving onto the frontier like point B means achieving full employment of resources.
Points above and to the right of the curve, such as point C, represent combinations that cannot be reached.
If an economy were to end up at point A on the graph, it would be producing no consumer goods at all; all resources would be used for the production of capital. If an economy were to end up at point B, it would produce only consumer goods.
The ppf illustrates a number of economic concepts. One of the most important is opportunity cost. The opportunity cost of producing more Beer is fewer Wine.
0:00 PPF Production Possibility Frontier
3:00 Opportunity cost on the PPF
#productionpossibilityfrontier #ppfexplained#ppcexplained #economics


